
As the amount of electronic information explodes, hierarchies to handle this information become huge and complex. Visualizing and interacting with these hierarchies become daunting tasks. The problem is exacerbated if the visualization is to be done on mass-market personal computers, with limited processing power and visual resolution.
Many of the current visualization techniques work effectively for hierarchies of 1000 nodes. But as the number of nodes increases toward 5000 nodes, these techniques tend to break down. Hierarchies above 5000 nodes usually require special modifications such as clustering, which can affect visual stability.
This paper introduces Cheops, a novel approach to the representation, browsing and exploration of huge, complex information hierarchies such as the Dewey Decimal system, which can contain between 1 million and 1 billion nodes. The Cheops approach maintains context within a huge hierarchy, while simultaneously providing easy access to details. This paper will also present some preliminary results from usability tests performed on an 8 wide by 9 deep classification hierarchy, which if fully populated would contain over 19 million nodes.
Keywords: Hierarchical representation, information visualization and exploration, focus+context techniques, graphical browser.
Resnikoff [8] observed that the processing of vast amounts of information available in the real world, by the human eye and other biological systems, is achieved by smoothly integrating a focused view of detail with a general view of context.
Even though we see detail for a small region, our peripheral vision provides the global context. This is important since we rely on the global context to orient ourselves and to make sense of the local detail before us.
Even with the advances in computer technology, computer screens use only a fraction of a human's normal field of vision. But increasingly, computers are displaying large and complex information spaces, such as hierarchies.
The main difficulty in representing a hierarchy is due to its exponential growth as expressed by:
![]()
where n represents the branching factor or number of nodes wide and k represents the number of levels deep of the hierarchy.
Table 1 shows the exponential growth of a hierarchy, based on the branching factor and depth of the hierarchy. The last row represents the Dewey Decimal classification hierarchy. The total number of nodes given assumes the hierarchy is fully populated.
| n | k | Total # of nodes | # nodes in last level |
| 3 | 3 | 13 | 9 |
| 3 | 6 | 364 | 243 |
| 6 | 6 | 9331 | 7776 |
| 8 | 9 | 19,173,961 | 16,777,216 |
| 10 | 10 | 1,111,111,111 | 1,000,000,000 |
Table 1 Exponential growth of a hierarchy
The enormity of the exponential growth can be seen in Table 2. The total drawing length for the hierarchies are calculated assuming 1.2 centimeter squares, drawn side by side, for the last level of the hierarchy. The 8x9 hierarchy would approximately cover the distance between Montreal to Ottawa whereas the 10x10 hierarchy would approximately go from Montreal to Calcutta.
| n | k | Drawing length (km) |
| 3 | 3 | 0.001 |
| 3 | 6 | 0.003 |
| 6 | 6 | 0.093 |
| 8 | 9 | 201.32 |
| 10 | 10 | 12000 |
Table 2 Exponential growth of a hierarchy
Even if a hierarchy is fully populated, huge hierarchies produce an additional problem: in a standard tree display, there will be a lot of unused space. A 10x10 hierarchy will have 1 billion nodes at the last level. But as one goes up a level in the hierarchy, the distance between the branches grows, resulting in large empty spaces. This problem of unused space becomes more acute if the hierarchy is sparsely populated. As the spacing between branches expands, it becomes more difficult for the user to maintain focus and context.
Our criteria for a successful hierarchical representation were:
The information presented by a hierarchy is of no use without an effective method to display and browse the information. As the hierarchies grow more complex, the sheer volume of information presented to the viewer becomes daunting.
Ideally, one would like to be able to simultaneously view and understand detailed information in a global context at all times for any size of information structure. This ideal is restricted by the resolution limits of the visual medium and by the limits of users' cognitive and perceptual capacities. Humans are limited in the density of information they can resolve and comprehend. Thus an active area of research focuses on the development of multiple strategies, based on fragmenting the view of the information.
Different fragmentation strategies tend to be best suited for different needs. For structural analysis of information, the aim is to support visual correlation, and thus the goal is to help the user compare topologically remote parts of a structure. For navigation in a structure, the aim is to provide powerful and refined navigation control and to graphically represent the path that the user has followed. The Cheops approach is intended for this second task, i.e. browsing and exploration tasks in complex hierarchical information structures. It is not intended for use in analyzing these structures.
Classical tree representations of hierarchies on screen require panning to view fragments of the information. Understanding of the global context is restricted by the memory of the viewer, because the global context and details are not presented simultaneously. A condensed overview of the whole hierarchy is often provided to support this cognitive effort.
Some people have developed strategies which attempt to convey information in a context-dependent manner. These strategies dynamically configure the view to present information within a global context.
One area of active research is the fish-eye or the focus+context technique. This technique fragments the information by providing one part in detail, while the global context is maintained through various visual compression procedures.
Furnas formalized the fish-eye technique for visualizing information [2]. Furnas' technique determines the size and position of information by using a degree-of-interest (DOI) function. Usually the DOI function uses the distance from the focus and a priori importance of the information. Various alternate techniques based on focus+context have been developed:
Whereas the focus+context method is useful for certain types of information visualization, there are some problems with the method, especially when applied to complex hierarchies. One serious problem is due to the DOI function. An increase in the slope of the DOI function causes the contextual information to become more distorted. In addition to this distortion, the sheer volume of information presented by a complex hierarchy, compared to the size of the focal area, could force the DOI to shift towards becoming a step function [8]. This would happen when attempting to display all the available information. As a result, distant information may become so small that it cannot be perceived.
An additional problem with focus+context methods is their speed. When the focus is changed, the size and location of the information may change. This can require recalculating the entire view. To smoothly animate changes, some of the methods redraw the view many times per second. This becomes difficult as the hierarchy grows complex, resulting in a degradation of speed.
Many of the techniques address hierarchies of 1000 to 5000 nodes. Because techniques such as cone-trees cannot display more than 5000 nodes, for these large hierarchies Carrièrre and Kazman [1] suggest clustering nodes to reduce visual clutter.
With the Cheops approach we attempt to provide a simple yet powerful method to explore very large hierarchies. The strategy maintains context within a complex hierarchy while providing easy access to details, without using techniques such as clustering, which could affect the visual stability of a hierarchy. Additionally, since no DOI function is required, updating the view when the focus changes does not require any major recalculation of the new view.
The following section will present the Cheops method. We will introduce the conceptual model, discuss terminology and visual cues, and then present navigation within the Cheops method.
The Cheops method is based on a compressed visualization of a hierarchical data set. The visual component for this method is a triangle. In Figure 1, a simple, binary hierarchy is presented in its logical form.
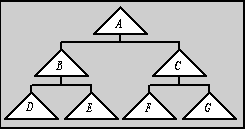
Figure 1 A binary hierarchy
In Figure 2, the same simple, binary hierarchy is presented in its Cheops form.
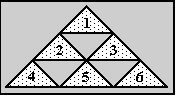
Figure 2 - Basic tessellation of triangles
If we think of Figure 2 as a compressed version of Figure 1, then triangle 5 could represent either node E or node F from Figure 1. In Cheops, if triangle 2 is selected, then triangle 5 will become node E. If triangle 3 is selected instead, then triangle 5 will become node F.
The visual representation of each logical branch of a hierarchy is, therefore, a result of a specific deployment of the previous levels.
If a larger hierarchy were to be represented using the type of tessellation shown in Figure 2, the visual components would express many logical nodes. By inserting overlapping triangles between the two end-points of a layer in the fundamental structure, we can distribute the logical nodes. Thus the resolution of the Cheops approach can be expanded. Figure 3 shows an expansion by adding 5 children (triangles) per parent.
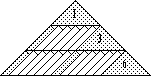
Figure 3 Insertion of overlaying triangles
Cheops reuses visual components through the alternate deployment of branches. This approach embeds the hierarchy in a linear-quadratic progression expressed as:
![]()
where n represents the branching factor and k represents the number of levels deep of the hierarchy. Tables 3a and 3b show comparisons between the logical and Cheops number of elements for different hierarchies.
| n | k | Total # of logical nodes | Total # of Cheops visual components |
| 3 | 3 | 13 | 9 |
| 3 | 6 | 364 | 36 |
| 6 | 6 | 9331 | 81 |
| 8 | 9 | 19,173,961 | 261 |
| 10 | 10 | 1,111,111,111 | 415 |
Table 3a Comparison of total elements
| n | k | # logical nodes in last level | # of Cheops visual components in last level |
| 3 | 3 | 9 | 5 |
| 3 | 6 | 243 | 11 |
| 6 | 6 | 7776 | 26 |
| 8 | 9 | 16,777,216 | 57 |
| 10 | 10 | 1,000,000,000 | 82 |
Table 3b Comparison of widths
One can quickly see the effective compression of the Cheops method. A 10x10 hierarchy using 1.2 centimeter triangles would only occupy 12 centimeters from left to right.
An example of the reuse of visual components is shown in Figure 4. Figure 4 shows a fully expanded 3x3 deep hierarchy and the resulting Cheops representation. The Cheops approach reduces the 13 logical node hierarchy into a 9 visual node pyramid and requires 1/3 the drawing area.
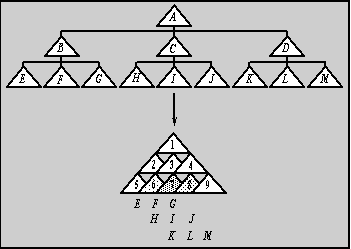
Figure 4 - Fully expanded 3x3 hierarchy and the Cheops representation.
It can be seen that three of the visual objects in the last level represent more than one logical node. These "overloaded" visual objects become unambiguous when a parent node is selected. For example, if node B is selected, through visual object 2, the result is shown in Figure 5.
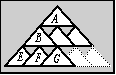
Figure 5 Resulting hierarchy with node B selected
Selection of a node implied selection of all its parent nodes, that is a branch. Thus the selection of visual object 7 can only mean logical node G if nodes A and B, visual objects 1 and 2, are highlighted. Thus the Cheops method represents nodes as paths of visual objects going down from the root, not as isolated triangles.
The engine of the Cheops approach is object-based. This allows the decoupling of the logical and visual hierarchy. It is easy to extract the structural information and to represent that information in other metaphors, such as choices or combo-boxes, concurrently with Cheops. Also, since the Cheops representation takes up less screen space, it is possible to display structural information in conjunction with the description of the actual content of an visual object.
Various visual cues and terminology were developed to aid the user in making the correct interpretation of the hierarchy presented by Cheops. Figure 6 shows the visual cues.
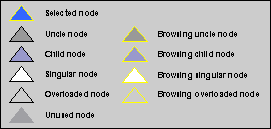
Figure 6 Visual Cues
A selected node is a node chosen by the user, when navigating through the hierarchy. When a node is selected, the user will be investigating the part of the hierarchy associated with that node. All the nodes at that level become uncle nodes and change color. All the children of the selected node also change color.
A singular node indicates that only one logical node is associated with that visual object. An overloaded node indicates more than one logical node is associated with that visual object. An unused node is a node which is not part of the current selected hierarchy. There are no unused nodes when the root is selected. Nodes become unused only when the user starts to descend down the hierarchy.
When a hierarchy is initially displayed, the complete hierarchy is shown. When a visual component, other than the root node, is selected, the hierarchy associated with this selected node is displayed. Any visual components that are not within the selected hierarchy will be set to the unused state.
The border of the visual components is used to indicate the focus point. When the cursor is moved into a visual component, the components that are being browsed are highlighted. The next section discusses selecting and browsing in more detail.
One of the main goals of the Cheops approach is to provide a fast and efficient manner to browse hierarchies. This is achieved by selecting a visual component. When selected, the branch of the hierarchy associated with the component is deployed or expanded. This fixes a reference node from which a subset of the hierarchical references is represented. By selecting different nodes, the user dynamically interacts with the representation of the hierarchy. With this dynamic navigation model, the users can maintain or restrict the view they have over the context of the deployed branch and its sub-branches, thus revealing particular information contained in the hierarchy.
Two main access techniques have been developed to support the deployment and exploration of the dynamic contextual representation. They are:
The selection technique allows the user to set a reference state of the hierarchy, or selection of a node, and the resulting structure of the sub-hierarchy is revealed by the subtraction of the branches outside the selection. Each branch deployed in a Cheops hierarchy has a unique visual profile as it would have in a classic expanded view of a tree structure, combining that visual indicator with the permanent stability of the general context of a Cheops representation, the user is provided with efficient discrimination cues to distinguish different branches in the hierarchy.
For example, Figure 7 shows a sparse, 8 by 9 classification hierarchy, used for information retrieved from the World Wide Web (WWW). The root node has been automatically selected and the complete hierarchy is displayed.
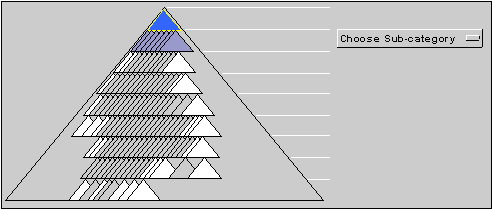
Figure 7 8 by 9 classification hierarchy
When the third child of the root node, Natural Sciences, is selected, via a mouse click within the visual component, the branch for this node is displayed, as shown in Figure 8. All the logical nodes attached to this node are displayed. All other nodes are set to unused. Thus the global context of the hierarchy is not lost. When the fifth child of Natural Sciences, Health/Medicine is selected, that branch is deployed as shown in Figure 9.
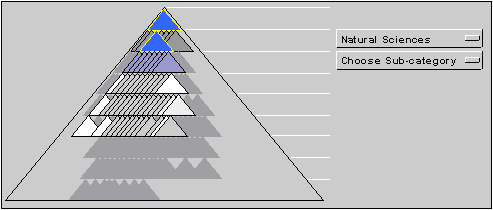
Figure 8 Deployment of Natural Sciences
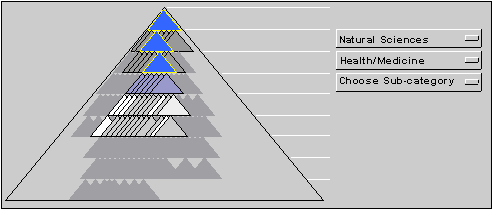
Figure 9 Deployment of Health/Medicine
It can be seen, with each deployment of a branch, that while changing the focus the user does not lose the context. The character of the hierarchy and the user's chosen path always remain visible.
Pre-selection allows the user to explore the hierarchy around and below the currently selected node without selecting a new node. As the cursor enters a visual component, the entire branch associated with the logical node is automatically highlighted, but not selected. If an overloaded node is entered, the branch for the first logical node, in depth order, is presented. By pressing any mouse button, the method will cycle through the list of all logical nodes associated with the visual component. This allows the user quick access to any branch within the hierarchy.
Figure 10 shows an example of pre-selection. When the seventh visual component, on the fifth level (which is an overloaded node) is entered, the logical node and branch is highlighted. In this case, the branch for the logical node labeled Evolution. When the mouse is clicked, the next logical node, Sorcery and the appropriate branch is now highlighted as shown in Figure 11. There are 10 additional branches associated with this visual component, including jazz ballet, polar research and secondary education.
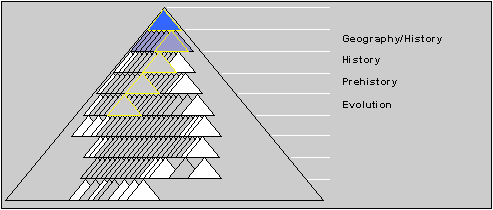
Figure 10 Pre-selection of Evolution
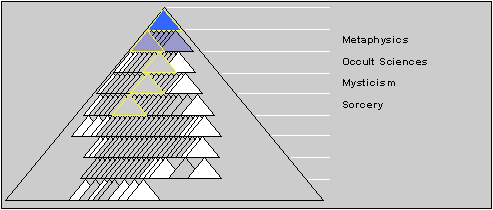
Figure 11 Pre-selection of Sorcery
Pre-selection allows the user quick and immediate access to any node within the hierarchy, without selecting and de-selecting branches.
The user's exploration of a Cheops representation can also be assisted by different selection attributes and quick access tools, extending the contextual details of the selection. These selection attributes and the compression of the structure facilitates navigation through the hierarchy, thus fulfilling two of the main user objectives: the exploration and location of information.
Figure 12 shows two access methods currently available with the approach. The two access methods are:
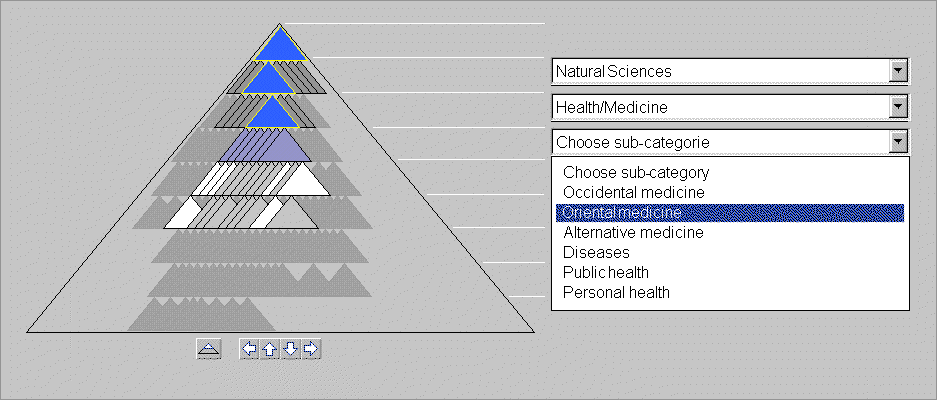
Figure 12 Cheops pyramid with access tools
Choices boxes are situated to the right of the pyramid, with one choice per level. When a node is selected, the choice box is updated with the "names" of child logical nodes.
Using the choice boxes, the user can navigate the hierarchy, one level at a time. As the user moves about with the choice boxes, the selected branch of the hierarchy is highlighted. Thus the user never loses context as they descend to the area of interest. Figure 7 shows an example of using the choice boxes for the logical node labeled Health/Medicine.
During pre-selection, the choice boxes are replaced by text. Visually, this provides a cue to the user; nothing is selected yet. This allows the user to see the "names" of the logical node in the pre-selected branch.
Depending on the screen area and number of nodes, the spacing between triangles can become small. Navigation can be difficult using the mouse. The navigation buttons (under the pyramid in figure 12) allow the user to move about the pyramid without using the triangles.
As the arrows indicate, the user can move up and down the hierarchy and to left or right. The selected node changes based on the navigation button pressed. An additional button allows the user to select the root node.
Additionally, when the cursor enters a navigation button, the next possible node is shown, emulating pre-selection. This provides a quick method for the user to determine which direction to go to.
Three additional access tools were investigated to aid the user.
The additional tools were:
A slider situated at the base of the pyramid, allowed the user to step through each individual logical branches or "slide" through the hierarchy, looking for a specific branch. The selected node was chosen by depth first order.
Bookmarks were envisioned as a manner to "save" deployed branches. There were two widgets that were used with the bookmarks. The first is a modified slider which allows the user to single step through the bookmarks. The second widget was a check box. The check box indicates if an opened branch is a bookmark or not.
Histograms were developed to show the user a summary of data associated with the child logical nodes. For example: how many documents were associated with the logical node, and the quality of these documents. By clicking on one of the histograms, the user could move down to the selected logical node. Within a document query system, this gives the user a quick access to areas of interest, since the number of documents and relative quality provide a simple method to indicate the area to investigate.
Prototyping of the Cheops approach was done using ToolBookTM and DelphiTM. Operational versions have been developed in C++ and JavaTM. The platforms these versions run on range from an Intel 486 to UNIX workstations.
Currently the main application that uses the Cheops approach is a document query system. This tool allows the user to browser through the hierarchy for specific categories such as botany or philosophy. Within this tool, the user can perform keyword searches and the appropriate URLs within the classification hierarchy are extracted.
Internally, the logical nodes are a hierarchy of objects, accessed through paths relative to any node (usually the root.) For example, the second child of the first child of the root would be designated by the string "01" (The root itself is the empty string.) The first child of that node would be "010". The visual elements are arranged in a simple vector for each level of the hierarchy, the levels themselves being treated as a linked list.
As the hierarchy is constructed, each logical node is assigned a visual node. Each state of the system (i.e. selected and pre-selected node) is reflected in the visual nodes that keep track of all currently active logical nodes assigned to each of them. This state is constructed by a depth-first traversal of the logical hierarchy, which can optionally be accomplished by visitor objects [4] along restricted paths. Resetting of the state can be accomplished more effectively by sequential traversal of the visual nodes.
The multithreaded architecture of Java allows asynchronous updating of all interface objects, pyramid, choices, and navigation buttons, reflecting the internal state upon change of that state. However, the state information itself is only manipulated by one object with its own state.
Initially, histograms were included with the applet, as a separate frame. As the URLs and quality of the keyword search were inserted into the classification hierarchy, the results were reflected by a growing histogram, as shown in Figure 13.
The height of the bar indicates the quality of the document whereas the width indicates the number of documents. The children of Health/Medicine are normalized so the user can quickly see where the documents are clustered. It should be noted that the histogram reflects the total number of documents within the complete sub-hierarchy for each child node.
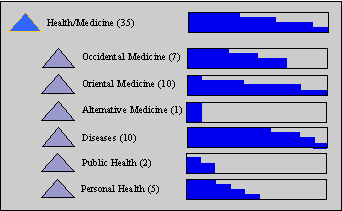
Figure 13 Sample histogram
It can be seen from the figure, the child node, Diseases, seems to be a likely candidate to investigate whereas Public Health is not.
The histograms provided an easy way to navigate and narrow the search for specific documents retrieved from the query.
Informal usability tests were performed to test Cheops, during the "proof of concept" phase, which ended February 1996. The version tested did not include the histograms, but did include all other access tools mentioned. The goal of the tests was to pinpoint the strengths and weakness of the approach, allowing us to determine the research areas for the next phase.
The tests focused on letting novice users navigate in a concept hierarchy to focus the scope of a classical (keyword-based) document query. The users were given no indication about the concepts underlying Cheops.
Almost all users solved the problem in less than a half hour, but not without some difficulties. Analysis of their difficulties mostly highlighted the lack of an adequate way to associate other information cues, like the choice boxes, with the hierarchical structure.
Also, the very richness of visual cues indicating the selection state threw many users off-balance. The Cheops pyramid, the slider and the choices were effectively three views and three controls on one single internal state and users found it somewhat difficult to integrate them into a whole.
The very power of tools like the slider, that allow jumping from one point of the hierarchy to another with little effort, betrayed the user's expectations of a continuous, gradual change associated with more familiar tools. They also complained about the fine manipulation of the mouse that was sometimes necessary to get at the closely-packed triangles.
On the other hand, it is interesting to note that this initial difficulty eventually allowed users to express a personal approach to the tool: while many users swiftly mastered the pyramid and looked at the text of the choices as words to put on a self-sufficient visual state, some others manipulated exclusively the choices and used the pyramid as a status, a confirmation of the choice manipulations.
All in all, the slider turned out to be the most difficult tool to understand; users expected the slider's cursor position to be aligned to the selected node. Unfortunately, such an alignment is a topological impossibility if the slider is to represent all the nodes in the logical hierarchy. Because of the difficulties, the slider was removed from the application.
At the end of the usability tests, the users, knowing the method was in an embryonic stage, indicated they could see the potential power of the Cheops method. Additionally, the users voiced they would like to be involved in the next usability tests, once the method matures.
Using the results from the initial usability tests, we can improve the interface and navigation facility that the Cheops method provides. The tests have also helped identify areas of research for different search paradigms that can be used within the Cheops method. Other plans include providing the user with multiple, hierarchical views and integrating user functions.
The initial implementation of the histograms showed that the Cheops method could be expanded to a multivariate tool. For the document query application, the histograms provide a simple method to identify the number of documents per category and their quality. The histograms can easily be expanded to represent different parameters, dependent on application. For example, a file manager could show a histogram based on file sizes.
An additional aspect of histograms is the ability to filter through the parameters, for example, searching for specific attributes of files, through a directory. The directory hierarchy would be shown, using the Cheops method. The user could first ask to display only the files which have a time stamp between two dates. The histogram would indicate the concentration for those files, within the directory hierarchy. The user could then specify to display any of these files which are larger than a certain size. This would provide a fast and efficient method to retrieve specific files.
We plan to further explore the potential power of the Cheops approach. We have been able to show the quantifiable aspects of the method but haven't qualified it. This would include comparisons between the Cheops approach to visualization of hierarchies and other currently available techniques. As the method matures, more usability tests will be performed, allowing us to start to qualify the approach. Additionally, it is expected that, since the Cheops approach allows the representation of complex hierarchies, we can start research into the cognitive factors required for navigation through complex hierarchies.
The interest in the Cheops method has been due to the technical simplicity the approach provides. This method is a practical and efficient method for an ordinary user to explore any type of complex hierarchies without being constrained by hardware considerations.
The authors would like to acknowledge all the other members of CRIM's Human Computer Interaction group for their insightful comments and suggestions.
[1] Carrièrre, J and Kazman R, Research Report Interacting with Huge Hierarchies: Beyond Cone Trees, In Proceedings of Information Visualization'95, (Atlanta, GA, October 1995), pp. 74-81.
[2] Furnas, G.W., Generalized fisheye views. In Proceedings of CHI'86 Human Factors in Computing Systems (Boston, MA, April 1986), ACM press, pp. 16-23.
[3] Lamping, J., Rao, R. and Pirolli, P., A Focus+Context Technique Based Geometry for Visualizing Large Hierarchies, In Proceedings of CHI'95 Human Factors in Computing Systems (Denver, CO, May 1995), ACM press, pp. 401-408.
[4] Gamma, E., Helm, R., Johnson, R., Vlissides, J., Design Patterns: Elements of Reusable Object-Oriented Software, Addison-Wesley Profession Computing Series, ISBN 0-201-63361-2 pp. 331-344
[5] Mackinlay, J., Card, S., and Robertson, G., Perspective Wall: Detail and Context Smoothly Integrated, In Proceedings of the ACM SIGCHI'91 Conference on Human Factors in Computing Systems (New Orleans, LA, April 1991), pp. 173-179.
[6] Resnikoff, H.L. "The Illusion of Reality", Springer-Verlag, New York, 1989.
[7] Robertson G.G., Mackinlay J.D., and Card, S., Cone Trees: Animated 3D Visualizations of Hierarchical Information, In Proceedings of the ACM SIGCHI'91 Conference on Human Factors in Computing Systems (New Orleans, LA, April 1991), pp. 189-194.
[8] Sarkar, M., Brown, M.H, Graphical Fisheye Views of Graphs. In Proceedings of ACM SIGCHI'92 Conference on Human Factors in Computing Systems (Monterey, CA, May 1992), ACM press, pp. 83-91
[9] Schaffer, D., Zuo Z., Bartram L., Dill, J., Comparing Fisheye and Full-Zoom Techniques for Navigation of Hierarchically Clustered Networks, In Graphics Interface '93 (Toronto, On, May 1993), pp. 87-96.
[10] Stone, M.C., Fishkin, K. and Bier, E.A, The Movable Filter as a User Interface Tool. In Proceedings of CHI'94 Conference on Human Factors in Computing Systems (Boston, MA, April 1994), ACM press, pp. 306-312

| CHEOPS: Registered trademark pending. © CRIM 1996 |
| CHEOPS: Marque de commerce en instance. © CRIM 1996 |